 Return to the Home Page | Translate this Page
 Solar Flares and
the Earth’s Earthquake Machine
Solar Flares and
the Earth’s Earthquake Machine
Evidence of Catastrophes in the Natural World
Catastrophes at the Time of the End
Part Seven
Translation by the New King James Version
Robert D. Mock MD
August, 2003
Graphics Editing, January, 2010
Section Two
Frequency of Occurrence of Earthquakes Based on Observations since 1900
The Richter Magnitude Scale Facts
Number of Earthquakes per Year - Magnitude 7.0 or greater – 1900-1998
Largest Earthquakes in the 21st Century
Largest Earthquakes in the World in the 20th Century
The 15 Largest Earthquakes in the Contiguous United States
The Most Destructive Earthquakes according to Centuries
The Earth’s Earthquake Machine
Will America be involved in future Time of the End Quakes?
Volcanoes in the United States
Largest Explosive Eruptions Since 1400 AD
Volcanoes to Watch at the End of Times
Prophetic Watchers at the End of Times
On Divine Judgments at the End of Times
God’s Judgment on the Chemical and Nuclear Weapons Industry.
Links to Earth Catastrophes
Weekly Volcanic Activity Report
Near Real Time World Earthquake Bulletins
Solar Storms - The Electrical Connection.
Earthquake and Volcano Eruptions
The Land of Israel is sitting on the western edge of the Arabian Tectonic Plate as it slides north/south along the side of the African Plate, which is pushing into the Anatolian Tectonic Plate, also north and south. Yet the Anatolian Plate is sliding east and west along the Eurasian Plate. As can be imagined, this is a very unstable part of the world and the site of some of the major catastrophic disasters recorded in the history of man.
For 3,500 years, we’ve had very little experience in living in a world of natural catastrophes. Let us look at earthquakes in an uniformitarian world. Based upon observations for the past 100 years, we can analyze the frequency of earthquakes around the earth in relations to their size or magnitude.
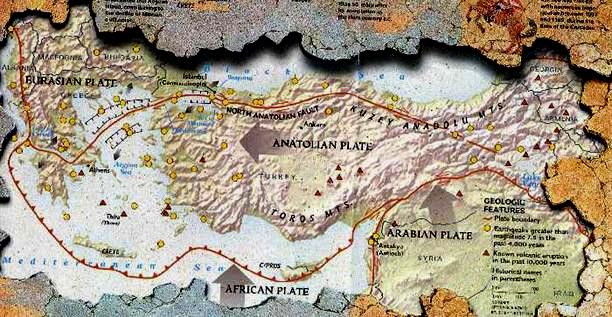
Tectonic Plates along the Arabian, African and the Eurasian Continents
Frequency of Occurrence of Earthquakes Based on Observations since 1900
|
Descriptor |
Magnitude |
Average Annually |
|
Great |
8 and higher |
1 |
|
Major |
7 - 7.9 |
18 |
|
Strong |
6 - 6.9 |
120 |
|
Moderate |
5 - 5.9 |
800 |
|
Light |
4 - 4.9 |
6,200 (estimated) |
|
Minor |
3 - 3.9 |
49,000 (estimated) |
|
Very Minor |
< 3.0 |
Magnitude 2 - 3:
about 1,000 per day |
The Richter Magnitude Scale Facts
When we look at the magnitude of an earthquake size, we must understand the following facts.
· The Richter Magnitude scale was developed in 1935 by Charles F. Richter of the California Institute of Technology as a mathematical device to compare the size of earthquakes.
· Seismic waves are the vibrations from earthquakes that travel through the Earth and are recorded on instruments called seismographs. Sensitive seismographs, which greatly magnify these ground motions, can detect strong earthquakes from sources anywhere in the world.
· The magnitude of an earthquake is determined from the logarithm of the amplitude of waves recorded by seismographs. On the Richter Scale, magnitude is expressed in whole numbers and decimal fractions.
Magnitude 5.3 might be computed for a moderate earthquake.
Seismograph Plotting an Earthquake Tremor
Magnitude 6.3 might be computed for a strong earthquake.
· Each whole number increase in magnitude represents a tenfold increase in measured amplitude, yet each whole number step in the magnitude scale corresponds to the release of about 31 times more energy.
· Earthquakes with magnitude of about 2.0 or less are usually called micro earthquakes; they are not commonly felt by people and are generally recorded only on local seismographs.
· Events with magnitudes of about 4.5 or greater or called moderate earthquakes - there are several thousand such shocks annually - are strong enough to be recorded by sensitive seismographs all over the world.
· Great earthquakes, such as the 1960 Valdivia earthquake in Chile (magn. 9.5), the Prince William Sound Good Friday Earthquake in Alaska (magn. 9.2), and the 2004 Indian Ocean Indonesian Christmas Earthquake and Tsunami (magn. 9.1 and Tsunami, have magnitudes of 8.0 or higher. On the average, one earthquake of such size occurs somewhere in the world each year.
· There are no upper limits in the magnitude of earthquakes. This will be a good consideration to remember and we consider the apocalyptic earthquakes during the last days before the coming of the Messiah.
· The largest known shocks have had magnitudes in the 9.0 to 9.2 range. Abridged from The Severity of an Earthquake, a U. S. Geological Survey General Interest Publication.
According to long-term records (since about 1900), we expect about 18 major earthquakes (7.0 - 7.9) and one great earthquake (8.0 or above) in any given year. However, let's take a look at what has happened in the past 28 years, from 1969 through 1996.
Our records show that 1992 is the first time that we have reached or exceeded the long-term average number of major earthquakes since 1971. In 1970 and in 1971 we had 20 and 19 major earthquakes, respectively, but in other years the total was in many cases well below the 18 per year which we may expect based on the long-term average. The following is a list of major earthquakes during this period of 1900 – 1998.
Number of Earthquakes
Worldwide for 2000 - 2010 with Magnitude 7.0 or greater
Located by the US Geological Survey National
Earthquake Information Center
1900 13 1930 13 1960 22 1990 13
1901 14 1931 26 1961 18 1991 10
1902 8 1932 13 1962 15 1992N 23
1903 10 1933 14 1963 20 1993M 16
1904 16 1934 22 1964 15 1994 15
1905 26 1935 24 1965 22 1995E 25
1906 32 1936 21 1966 19 1996 22
1907 27 1937 22 1967 16 1997 20
1908 18 1938 26 1968 30 1998 16
1909 32 1939 21 1969 27 1999 13
1910 36 1940 23 1970 29 2000 15
1911 24 1941 24 1971 23 2001 16
1912 22 1942 27 1972 20 2002 13
1913 23 1943* 41 1973 16 2003 15
1914 22 1944 31 1974 21 2004 16
1915 18 1945 27 1975 21 2005 12
1916 25 1946 35 1976$ 25 2006 11
1917 21 1947 26 1977 16 2007 18
1918 21 1948 28 1978 18 2008 12
1919 14 1949 36 1979 15 2009 17
1920 8 1950 39 1980 18 2010 7
1921 11 1951 21 1981 14 May 15, 2010 data
1922 14 1952 17 1982 10
1923 23 1953 22 1983 15
1924 18 1954 17 1984 8
1925 17 1955 19 1985 15
1926 19 1956 15 1986# 6
1927 20 1957 34 1987 11
1928 22 1958 10 1988 8
1929 19 1959 15 1989 7
Total 1900-1997 = 1960 events = 20 per year
Number of Earthquakes Worldwide for 2000 -
2010
Located by the US Geological Survey National Earthquake Information Center
|
Magnitude |
2000 |
2001 |
2002 |
2003 |
2004 |
2005 |
2006 |
2007 |
2008 |
2009 |
2010 |
|
8.0 to 9.9 |
1 |
1 |
0 |
1 |
2 |
1 |
2 |
4 |
0 |
1 |
1 |
|
7.0 to 7.9 |
14 |
15 |
13 |
14 |
14 |
10 |
9 |
14 |
12 |
16 |
6 |
|
6.0 to 6.9 |
146 |
121 |
127 |
140 |
141 |
140 |
142 |
178 |
168 |
142 |
73 |
|
5.0 to 5.9 |
1344 |
1224 |
1201 |
1203 |
1515 |
1693 |
1712 |
2074 |
1768 |
1754 |
817 |
|
4.0 to 4.9 |
8008 |
7991 |
8541 |
8462 |
10888 |
13917 |
12838 |
12078 |
12291 |
6928 |
3457 |
|
3.0 to 3.9 |
4827 |
6266 |
7068 |
7624 |
7932 |
9191 |
9990 |
9889 |
11735 |
2898 |
1078 |
|
2.0 to 2.9 |
3765 |
4164 |
6419 |
7727 |
6316 |
4636 |
4027 |
3597 |
3860 |
3007 |
1007 |
|
1.0 to 1.9 |
1026 |
944 |
1137 |
2506 |
1344 |
26 |
18 |
42 |
21 |
25 |
11 |
|
0.1 to 0.9 |
5 |
1 |
10 |
134 |
103 |
0 |
2 |
2 |
0 |
1 |
0 |
|
No Magnitude |
3120 |
2807 |
2938 |
3608 |
2939 |
864 |
828 |
1807 |
1922 |
20 |
11 |
|
Total |
22256 |
23534 |
27454 |
31419 |
31194 |
30478 |
29568 |
29685 |
31777 |
*14792 |
*6461 |
|
Estimated |
231 |
21357 |
1685 |
33819 |
22880 2 |
8800 3 |
6605 |
712 |
88011 |
1787 |
225420 |
Number of Earthquakes Worldwide for 2000 - 2010
* Most active year since 1900
# Least active year since 1900
$ Year with most people killed since 1900 (295,000 - 699,000;
dominated by the Tangshan quake with casualty estimate from
255,000 - 655,000)
N First full year of operation on NSN/digital recording system
M Year moment magnitude quotes were introduced
E Year energy magnitude quotes were introduced
Statistics were compiled from the Earthquake Data Base System of the U.S. Geological Survey, National Earthquake Information Center, Golden,CO
Analysis of such data can bring some interesting insights. It is my strong recollection, that two big eras in recent history, there had been a wave of evangelism and intense messianic expectations in the revealing of the Messiah. In the late fifties, Christian tent evangelism complete with sawdust floors reminiscent of the Sawdust Festivalsl era of the 1830s, Christian evangelists expounded with great fervor on the ‘minutes before midnight’ expectation of the return of Jesus the Messiah.
Then again in the 1962 to 19072 era, Adventist fundamentalist evangelists along with the Campus Crusade for Christ dominated the religious fervor scene of apocalyptic expectations.
By analyzing the above earthquake records, 1957 and 1967-72 era were big resurgence years in earthquake numbers. It is also of interest there has been a lull in major earthquake activity for the last decade (1988-99) with only one year exceeding the average number of earthquakes in the past century.
Taking a cosmic viewpoint, if G-d was using earthquakes to warn mankind to start preparing for his potential coming, then it would appear that 1905 – 1914 would be a potential era. For historians Adventist history, it would be of interest to draw parallel references to apocalyptic interest in end time events with the number of earthquakes noted per year. This era historically was a critical time in the Seventh-day Adventist Church.
The prophetic messages of Ellen Gould White were in the waning years, yet the church was kept embroiled in political dissension with the John Harvey Kellogg and Battle Creek Sanitarium split. Spiritual resuscitation was not in the cards, for this small part of G-d’s Christian Israelite people, who of all Christendom, were the most apocalyptic, minded. God’s prophetic people were in no mood to be ready for his coming.
Yet at the same time there was resurgence within another group of Advent Christians, the Jehovah’s Witnesses. In 1873 and 1874, N.H. Barbour with the Herald of the Morning, and George Storrs, the publisher of the Bible Examiner, and founder of the Life and Advent Union, promoted the date of the return of Jesus. When Christ did not return on those dates, Barbour turned to the Diaglott translation of the New Testament by Benjamin Wilson, in which the ‘coming’ of Jesus, was translated the ‘presence’ of Jesus in Matthew. This produced the ability to escape another disappointment in 1874. It was Storrs and Barbour, who were the Adventist leaders that became the religious mentors of the teenager, Charles Taze Russell along with the Advent Christian Church minister, later Jehovah Witness founder, George Stetson.
It was the Herald of the Morning, which imprinted the belief that Jesus returned invisibly in 1874, affected Charles Taze Russell and became the imprint of the future Jehovah’s Witness, when he first published the Zion’s Watch Tower in 1879. Here he publicized the belief in the invisible return of Jesus in 1874. In the November, 1881 issue, he acknowledged also his roots to the Millerite and the 1830-1840 Advent movement called the Second Great Awakening.
Jehovah’s Witnesses fundamental tenets as proclaimed in the theology of the Watchtower today is that Christ returned invisible around October 4 or 5 in 1914. Few Witnesses are aware that their denomination taught that Jesus had returned invisibly forty years earlier in 1874 and was the primary reason for Charles Taze Russel for starting the publication of Zion’s Watch Tower and Herald of Christ’s Presence in 1879. Actually the 1874 and the 1914 date were interchanged back and forth for almost a decade as new dates continued to be set, 1918 and then 1925. Actually few Jehovah’s Witnesses know that the dates for their predicted coming of Jesus either visible in 1874 or invisible in 1914 were in direct alignment with larger numbers of earthquakes in this world.
Another moderately elevated period for earthquakes was in the 30’s when most of the world was struggling with survival in the Great Depression. This came with a more critical period of increased seismic activity in the 40’s. Whether the increase in earthquakes in the 30’s and 40’s was a partial cause of the increasing restless nature of man-kind, which depicted itself in WW II is not totally known? What was known historically was the global anti-Semitic antipathy of America and the rest of the world to assist in the reclamation of the Jewish people whose lives were daily being incinerated in the Nazi concentration camp ovens. Those Jewish people who were able to flee for their lives were prevented by all European countries and the United States to their physical destruction. Not one Christian Church offered sympathy or protest except the Jehovah’s Witnesses. So while the world was too busy embroiled in WW II, creating the Holocaust in Germany and defending the last gasp of Imperial power of the Japanese, the Jewish people who survived were praying for that one gasp of hope for their own homeland in Israel.
Men were unable to focus on a spiritual path of elevation, enlightenment and hopeful transformation in anticipation of the second-coming of Jesus. It is no wonder that G-d will not allow the coming of His Messiah be revealed until there is a people spiritually sensitive to receive Him. G-d must have a people waiting for Him. It won’t be just anyone, only those who have prepared themselves to be transformed back into the edenic ‘image of God’ that we were initially created.
Once again we saw a small resurgence of Christian messianism in the mid-1950s, a resurgence in earthquakes and also a resurgent era of the sawdust camp-meetings and evangelistic meetings. What happened? I’m not sure. Laodicea?
And then there was the 60’s and 70’s. Somehow in a cosmic framework, can we perceive the evidence that God and the forces of Good may be using is using seismic activity to try to awaken mankind to his destiny of spiritual growth? Can we perceived that Satan (Lucifer) is busy trying to create scientific dissension (evolution), church dissension (Splits within many churches of Christendom), political dissension (Wars, holocausts and genocide) and social dissent (student uprising, family disintegration, and social fracturing of society), to keep man so preoccupied and so busy, so they cannot prepare themselves for the Messiah’s return.
Will there be resurgence of earthquakes in the 21st century? Today the trend is clear and with a resounding affirmation. The question, will this time a people rise and speak with a loud voice, “Fear God and give glory to Him, for the Hour of his Judgment is come. Worship Him that made heaven and earth?” (Revelation 14:7) Will there be a spiritual people, in whatever religious community, who are spiritually inclined to listen to God’s quiet voice, to form a nurturing society of trusting transparent believers preparing to meet their Maker? If this is to be our generation, then our spiritual growing is having to be put on the fast track.
What is our most recent evidence of earthquakes (EQ)?
Largest Earthquakes in the 21st Century
Year EQs over 7.0 Number of Deaths Largest quake – Region - Size
1999 13 22,711 September 30 -- Oaxaca, Mexico -- 7.5M
Most deadly EQ – August 17, Turkey – 7.6M - 17,000 killed, 50,000 Injured, thousands missing,
600,000 homeless
2000 15 213 November 16 -- New Ireland Region, P.N.G. -- 8.0M
Most deadly EQ – June 4, Southern Sumatera, Indonesia – 7.9M - 103 killed, 2,174
injured.
2001 15 21,358 June 23 -- Near Coast of Peru -- 8.4M
Most deadly EQ - January 26 - India – 7.7M - 20,085 people killed, 166,836 injured, about 339,000 buildings destroyed and 783,000 damaged in the Bhuj-Ahmadabad-Rajkot area and other parts of Gujarat
When we analyze this data it suggests that earthquakes are presently not in a high state or escalating state of progression in spite of the onset of the second millennium. At the same time, this data, nor any I’ve seen looks at the critical type of earthquake, the deep core quakes which suggestion major earth core shifting or major shifting in the major tectonic plates under the continents. Are we getting more deeper core quakes, showing major deep crustal plate movement? That data, we do not have.
What then must one look for in anticipation for the Big Quake? First, we must find a persistent trend in deep core earthquakes of significant magnitude. Second, we must see progressive number of quakes, though shallow, in major population areas with devastation, increasing loss of life and property. Third, these earthquakes must be associated with an increase in volcanoes around the world depicting major seismographic changes going in the surface crust of the earth.
Let’s now focus down on major quakes of this past century.
Largest Earthquakes in the World since 1900
Largest Earthquakes in the World in the 20th Century
|
|
Location |
Date UTC |
Magnitude |
Lat. |
Long. |
Reference |
|
1. |
1960 05 22 |
9.5 |
-38.29 |
-73.05 |
Kanamori, 1977 |
|
|
2. |
1964 03 28 |
9.2 |
61.02 |
-147.65 |
Kanamori, 1977 |
|
|
3. |
2004 12 26 |
9.1 |
3.30 |
95.78 |
Park et al., 2005 |
|
|
4. |
1952 11 04 |
9.0 |
52.76 |
160.06 |
Kanamori, 1977 |
|
|
5. |
2010 02 27 |
8.8 |
-35.846 |
-72.719 |
PDE |
|
|
6. |
1906 01 31 |
8.8 |
1.0 |
-81.5 |
Kanamori, 1977 |
|
|
7. |
1965 02 04 |
8.7 |
51.21 |
178.50 |
Kanamori, 1977 |
|
|
8. |
2005 03 28 |
8.6 |
2.08 |
97.01 |
PDE |
|
|
9. |
1950 08 15 |
8.6 |
28.5 |
96.5 |
Kanamori, 1977 |
|
|
10. |
1957 03 09 |
8.6 |
51.56 |
-175.39 |
Johnson et al., 1994 |
|
|
11. |
2007 09 12 |
8.5 |
-4.438 |
101.367 |
PDE |
|
|
12. |
1938 02 01 |
8.5 |
-5.05 |
131.62 |
Okal and Reymond, 2003 |
|
|
13. |
Kamchatka |
1923 02 03 |
8.5 |
54.0 |
161.0 |
Kanamori, 1988 |
|
14. |
1922 11 11 |
8.5 |
-28.55 |
-70.50 |
Kanamori, 1977 |
|
|
15. |
Kuril Islands |
1963 10 13 |
8.5 |
44.9 |
149.6 |
Kanamori, 1977 |
Looking at this chart suggests that the largest quakes are in the 8.5-9.5 Mw area. Yet is this reflective of the earthquakes in the time of the end as foretold by the Hebrew Prophets and Revelation? I don’t think so.
A catastrophic earthquake, associated with major worldwide volcanism and polar shifting as foretold in the latter days of Biblical prophecy, would be in the 9 plus magnitude category, and some experts suggest a major earthquake of 13-15 Mw.
Compare this with the 1906 San Francisco Earthquake at 7.7 Mw, which Ellen White, one of the early Advent leaders predicted and would become the most destructive quake in the United States history.
· 9 Mw quake would be 31 times more powerful,
· 10 Mw quake would be 961 times more powerful,
· 11 Mw quake would be 29,791 times more powerful,
· 12 Mw quake would be 923,521 times more powerful,
· 13 Mw quake would be 28,629,151 times more powerful than the San Francisco quake.
The “Great Earthquake” projected in scripture at the coming of the Messiah, could herald a catastrophic toll of over 90% of the population of this world. Since there are not any Arks of safety for man in this type of catastrophe such as there was for the Great Flood, then salvation for mankind would demand a supernatural intervention. Would this require moving man out of this three-dimensional world into a fourth dimensional world at the coming of the Maschiah ben Dovid (Messiah son of David)? The resurrection, the rapture and the revealing of the Messiah in “clouds of glory” suggests that an elevated state of consciousness is in the reality of those saved from destruction by Divine intervention.
Since a lot of Christians, most as the Lost Tribes of Israel, and almost half of world’s Jewry lives in the United States, the big question is what predictable changes can be forecasted for America at the end of times.
Understanding that Hawaii and Alaska are one of the largest quake regions in the world, we now look at the Top 15 quakes in America that do not included Alaskan and Hawaii based earthquakes.
The 15 Largest Earthquakes in the Contiguous United States
Alaska and Hawaii are one of the largest quake regions in the world
1. New Madrid, Missouri 1812 02 07 09:45 UTC 7.9 Mw
2. Fort Tejon, California 1857 01 09 16:24 UTC 7.9 Mw
3. Owens Valley, California 1872 03 26 10:30 UTC 7.8 Mw
4. Imperial Valley, California 1892 02 24 07:20 UTC 7.8 Mw
5. New Madrid, Missouri 1811 12 16 08:15 UTC 7.7 Mw
6. San Francisco, California 1906 04 18 13:12:21 UTC 7.7 Mw
7. Pleasant Valley, Nevada 1915 10 03 06:52:48.0 UTC 7.7 Mw
8. New Madrid, Missouri 1812 01 23 15:00 UTC 7.6 Mw
9. Landers, California 1992 06 28 11:57:34 UTC 7.6 Mw
10. Kern County, California 1952 07 21 11:52:14.0 UTC 7.5 Mw
11. West of Lompoc, California 1927 11 04 13:50 UTC 7.3 Mw
12. Dixie Valley, Nevada 1954 12 16 11:07:11 UTC 7.3 Mw
13. Hebgen Lake, Montana 1959 08 18 06:37:13.5 UTC 7.3 Mw
14. Borah Peak, Idaho 1983 10 28 14:06:06.5 UTC 7.3 Mw
15. West of Eureka, California 1922 01 31 13:17:22 UTC 7.3 Mw
We should note widely differing magnitudes have been computed for some of these earthquakes; the values differ according to the methods and data used. For example, some sources list the magnitude of the 8.7 Rat Islands earthquake as low as 7.7. On the other hand, some sources list the magnitude of the February 7, 1812 New Madrid quake as high as 8.8. Similar variations exist for most events on this list, although generally not so large as for the examples given.
Whatever the variation, there appear to be three major unstable regions in America. A summary of the continental U.S. earthquakes, suggests that major seismic activity in the United States will more than likely be in these following three areas:
California – 8 quakes greater than 7.3
Missouri – 3 quakes greater than 7.3
Nevada – 2 quakes greater than 7.3
Idaho – 1 quakes greater than 7.3
Montana – 1 quakes greater than 7.3
In general, the magnitudes given in the list above have been determined from the seismic moment, when available. For very large earthquakes, the moment magnitude is considered to be a more accurate determination than the traditional amplitude magnitude computation procedures. Note that all of these values can be called "magnitudes on the Richter scale," regardless of the method used to compute them.
Source: Seismicity of the United States, 1568-1989 (Revised), by Carl W. Stover and Jerry L. Coffman, U.S. Geological Survey Professional Paper 1527, United States Government Printing Office, Washington: 1993.
Another interesting investigation is looking at the most destructive earthquakes in reference to loss of human life. For students of prophecy, the Lisbon earthquake of 1755 is of interest because it is placed within some models of end time prophecies. It is of interest how other more devastating earthquakes were not considered as a key to prophetic fulfillment of end time events. Are prophecy watchers really being honest in only looking at the quakes in the western hemisphere? Let us consider the following statistics.
Most Destructive Known Earthquakes on Record in the World
(50,000 deaths or more)
(Listed in order of greatest number of deaths)
Date Location Deaths Mag Comments
January 23, 1556 China, Shansi 830,000
October 11, 1737 India, Calcutta** 300,000
July 27, 1976 China, Tangshan 255,000* 8.0 Estimated death toll as
(official) high as 655,000.
August 9, 1138 Syria, Aleppo 230,000
May 22, 1927 China, near Xining 200,000 8.3 Large fractures.
December 22, 856+ Iran, Damghan 200,000
December 16,1920 China, Gansu 200,000 8.6 Major fractures, landslides.
March 23, 893+ Iran, Ardabil 150,000
September 1, 1923 Japan, Kwanto 143,000 8.3 Great Tokyo fire.
December 28, 1908 Italy, Messina 70,000 7.5 Deaths earthquake and tsunami.
To 100,000 (estimated)
September, 1290 China, Chihli 100,000
November, 1667 Caucasia, Shemakha 80,000
November 18,1727 Iran,Tabriz 77,000
November 1,1755 Portugal, Lisbon 70,000 8.7 Great prophetic tsunami.
December 25, 1932 China, Gansu 70,000 7.6
May 31, 1970 Peru 66,000 7.8 $530,000 damage, rock slide, floods.
1268 Asia Minor, Silicia 60,000
January 11, 1693 Italy, Sicily 60,000
May 30, 1935 Pakistan, Quetta 30,000 7.5 Quetta almost completely destroyed.
To 60,000
February 4, 1783 Italy, Calabria 50,000
June 20, 1990 Iran 50,000 7.7 Landslides.
* Official casualty figure--estimated death toll as high as 655,000.
+ Note that these dates are prior to 1000 AD. No digit is missing.
** Later research has shown that this was a typhoon, not an earthquake.
(Source: The 1737 Calcutta Earthquake and Cyclone Evaluated by
Roger Bilham, BSSA, Vol. 84, No. 5, October 1994)
Data compiled from several sources.
United States Geological Survey National Earthquake Information Center
Earthquakes with 20,000 or More Deaths 1900-2010
Open for Earthquakes with 1,000 or More Deaths since 1900-2010
|
Date UTC |
Location |
Deaths |
Magnitude |
Comments |
|
1908 12 28 |
Messina, Italy |
72,000 |
7.2 |
Over 40% of the population of Messina and more than 25% of Reggio di Calabria killed by the earthquake and tsunami, Casualty toll is based on census data 1901-1911, some estimates are as high as 110,000. Tsunami 6-12 m (20-39 ft) coast of Sicily south of Messina and 6-10 m (20-33 ft) coast of Calabria. Aftershocks till 1913. |
|
1915 01 13 |
Avezzano, Italy |
32,610 |
7.0 |
Severe damage in the Avezzano-Pescina area. Estimated 3,000 additional people died next few months from indirect effects of the earthquake. Felt throughout Central Italy from Veneto to Basilicata. |
|
1920 12 16 |
Haiyuan, Ningxia
(Ning-hsia), China |
200,000 |
7.8 |
Total destruction (XII - the maximum intensity on the Mercalli scale) in the Lijunbu-Haiyuan-Ganyanchi area. Over 73,000 people were killed in Haiyuan County. A landslide buried the village of Sujiahe in Xiji County. More than 30,000 people were killed in Guyuan County. Nearly all the houses collapsed in the cities of Longde and Huining. Seiches from this earthquake were observed in 2 lakes and 3 fjords in western Norway. Although usually called the Kansu (now Gansu) earthquake by Western sources, the epicenter and highest intensities are clearly within Ningxia Autonomous Region. |
|
1923 09 01 |
Kanto (Kwanto),
Japan |
142,800 |
7.9 |
Extreme destruction in the Tokyo - Yokohama area from the earthquakeand subsequent firestorms, which burned about 381,000 of the more than 694,000 houses that were partially or completely destroyed. Although often known as the Great Tokyo Earthquake (or the Great Tokyo Fire), the damage was apparently most severe at Yokohama. |
|
1927 05 22 |
Gulang, Gansu
(Kansu), China (est, 250,000) |
40,900 |
7.6 |
Extreme damage in the Gulang-Wuwei area. Landslides buried a town near Gulang and dammed a stream in Wuwei County, creating a new lake. Large fissures and sandblows occurred in the area. Some sources list the death toll as high as 200,000, but this may be confusion with the much-bigger Ningxia quake of 1920. Also, Gu et al. report that over 250,000 livestock were killed by this earthquake. [ 310,311,92,3 ] |
|
1935 05 30 |
Quetta, Pakistan
(Baluchistan, India) |
30,000 |
7.6 |
Quetta almost completely destroyed. There were numerous fractures and landslides in the area. |
|
1939 01 25 |
Chillan, Chile |
28,000 |
7.8 |
Extreme damage in the Cauquenes-Chillan area. It was felt from Arica to Puerto Aisen. |
|
1939 12 26 |
Erzincan, Turkey |
32,700 |
7.8 |
Extreme damage in the Erzincan Plain and the Kelkit River Valley.] |
|
1948 10 05 |
Ashgabat (Ashkhabad),
Turkmenistan (Turkmeniya, USSR) |
110,000 |
7.3 |
Extreme damage in Ashgabat (Ashkhabad) and nearby villages, where almost all brick buildings collapsed, concrete structures were heavily damaged and freight trains were derailed. Many sources list the casualty total at 10,000, but a news release on 9 Dec 1988 advised that the correct death toll was 110,000. |
|
1974 05 10 |
China |
20,000 |
6.8 |
|
|
1976 02 04 |
Guatemala |
23,000 |
7.5 |
The earthquake was centered about 160 kilometers northeast of Guatemala City. Over 23,000 deaths. Thousands injured. Damage was extensive. Most adobe type structures in the outlying areas of Guatemala City were completely destroyed, leaving thousands homeless. |
|
1976 07 27 |
Tangshan, China |
255,000 |
7.5 |
Official casualty figure is 255,000 deaths. Estimated death toll as high as 655,000. 799,000 injured and extensive damage in the Tang-Shan area. Damage extended as far as Beijing. This is probably the greatest death toll from an earthquake in the last four centuries, and the second greatest in recorded history. |
|
1988 12 07 |
Spitak, Armenia |
25,000 |
6.8 |
Two events about 3 seconds apart. At least 25,000 people killed, 19,000 injured and 500,000 homeless in the Leninakan-Spitak-Kirovakan area of northern Armenia, USSR. More than 20 towns and 342 villages were affected and 58 of them were completely destroyed. Damage totaled 16.2 billion U.S. dollars. |
|
1990 06 20 |
Western Iran |
40,000 to 50,000 |
7.4 |
Estimated 40,000 to 50,000 people killed, more than 60,000 injured, 400,000 or more homeless and extensive damage and landslides in the Rasht-Qazvin-Zanjan area, Iran. Nearly all buildings were destroyed in the Rudbar-Manjil area. |
|
2001 01 26 |
Gujarat, India |
20,085 |
7.6 |
At least 20,085 people killed, 166,836 injured, approximately 339,000 buildings destroyed and 783,000 damaged in the Bhuj-Ahmadabad-Rajkot area and other parts of Gujarat. |
|
2003 12 26 |
Southeastern Iran |
31,000 |
6.6 |
About 31,000 people killed, 30,000 injured, 75,600 homeless and 85 percent of buildings damaged or destroyed in the Bam area. Believed to be the largest earthquake in this area in more than 2000 years |
|
2004 12 26 |
Sumatra |
227,898 |
9.1 |
This is the third largest earthquake in the world since 1900 and is the largest since the 1964 Prince William Sound, Alaska earthquake. In total, 227,898 people were killed or were missing and presumed dead and about 1.7 million people were displaced by the earthquake and subsequent tsunami in 14 countries in South Asia and East Africa. (In January 2005, the death toll was 286,000. In April 2005, Indonesia reduced its estimate for the number missing by over 50,000.) The tsunami caused more casualties than any other in recorded history and was recorded nearly world-wide on tide gauges in the Indian, Pacific and Atlantic Oceans. |
|
2005 10 08 |
Pakistan |
86,000 |
7.6 |
At least 86,000 people killed, more than 69,000 injured and extensive damage in northern Pakistan. The heaviest damage occurred in the Muzaffarabad area, Kashmir where entire villages were destroyed and at Uri where 80 percent of the town was destroyed. At least 32,335 buildings collapsed in Anantnag, Baramula, Jammu and Srinagar, Kashmir. |
|
2008 05 12 |
Eastern Sichuan,
China |
87,587 |
7.9 |
At least 69,195 people killed, 374,177 injured and 18,392 missing and presumed dead in the Chengdu-Lixian-Guangyuan area. More than 45.5 million people in 10 provinces and regions were affected. At least 15 million people were evacuated from their homes and more than 5 million were left homeless. An estimated 5.36 million buildings collapsed and more than 21 million buildings were damaged in Sichuan and in parts of Chongqing, Gansu, Hubei, Shaanxi and Yunnan. The total economic loss was estimated at 86 billion US dollars. Landslides also dammed several rivers, creating 34 barrier lakes which threatened about 700,000 people downstream. A train was buried by a landslide near Longnan, Gansu. At least 2,473 dams sustained some damage and more than 53,000 km of roads and 48,000 km of tap water pipelines were damaged.. |
|
2010 01 12 |
Haiti region |
222,570 |
7.0 |
According to official estimates, 222,570 people killed, 300,000 injured, 1.3 million displaced, 97,294 houses destroyed and 188,383 damaged in the Port-au-Prince area and in much of southern Haiti. |
These statistics portrays two major points: The Lisbon earthquake is estimated as the most powerful quake in this Most Destructive List in history, yet we do know there were more powerful quakes that had very minimal destruction. Most earthquake models on the time of the end events appear to focus on the Divine cosmic interest on the western world. We act as though the eastern world is not within the interest of Divine intervention. This is itself might be a major reason why many prophetic models concerning the times of the end of deficient. The whole world is of interest to the G-d of Israel and deaths in India, China, Syria, Iran and Japan are just as important as New York, Los Angeles and San Francisco.
If we are looking for natural processes during the decades of the 1700’s to portray God’s interaction in the prophecies of Daniel and Revelation, then a trend which depicts the decade of 18th century as escalating in catastrophic events would be of interest.
And such an event is noted. For 300 years, the western did not have any catastrophic earthquakes, outside of China, which was totally unknown to Europe in 1556. Then we do see a trend in the 18th and 20th centuries in number of earthquakes and the astronomic loss of human life associated with these quakes.
The Most Destructive Earthquakes according to Centuries
1000 to 2000 AD
(Earthquakes with 50,000 for more people who have died)
1000-1100 none
1100-1200 1136 230,000 Syria Total 12th c. = 230,000
1200-1300 1290 100,000 China Total 13th c. = 100,000
1300-1400 None Total 14th c. = None
1400-1500 None Total 15th c. = None
1500-1600 1556 830,000 China Total 16th c.= 830,000
1600-1700 1667 80,000 Caucasia
1693 60,000 Italy Total 17th c.= 80,000
1700-1800 1727 20,000 Iran
1737 300,000 India
1755 70,000 Lisbon
1783 50,000 Italy Total 18th c. = 490,000
1800-1900 None Total 19th c. = none
1900-2000 1908 70,000 Italy
1920 200,000 China
1923 143,000 Japan
1927 200,000 China
1932 70,000 China
1970 65,000 Peru
1990 50,000 Iran
1999 17,000 Turkey Total 20th c. = 798,000
2000-2020 2001 20,000 India
2004 227,898 Sumatra, Indonesia
2005 86,000 Pakistan
2008 87,587 China
2010 222,570 Haiti Total 21st c. = 624,055
First decade only
Maybe we are finding clues to the resurgence of the earth’s earthquake machine and how in G-d’s appointed time a new era of global catastrophes is also resurging. The 20th century is turning out to be the most deadly earthquake century on record in over a thousand years, especially if we discount the worst recorded earthquake in the last 1000 years if we discount the earthquake in China with 830,000 people who died. One more major earthquake in the first decade of the 21st century and we will be recognized as the worse earthquake century in a thousand years.
Maybe Lisbon is not that important except it was the arena of focus to the students of Biblical prophecies during the Great Awaking and the Advent Movement of the 1830’s to 1840’s. It also appears that China, Peru, India, Iran and Japan must play into God’s plan to awaken his people.
When it comes to major earth changes, maybe biblical students should take a more holistic viewpoint and consider God’s global intervention or lack of intervention instead of just in the western Christian world.
The Earth’s Earthquake Machine
According to Nature
Magazine in April 30, 2001, scientist Alessandro Forte of the University of
Western Ontario and Jerry Mitrovica of the University of Toronto found that the
earth is fueled by a four piston heat engine 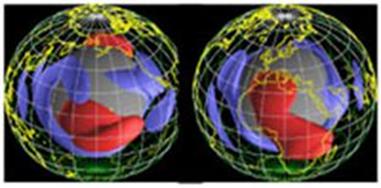 with
two large sinking cold slabs and two equally large rising hot flumes. This heat engine is the
responsible agent for the generation of earthquakes, volcanoes, continental
tectonic plate movements and even climate changes.
with
two large sinking cold slabs and two equally large rising hot flumes. This heat engine is the
responsible agent for the generation of earthquakes, volcanoes, continental
tectonic plate movements and even climate changes.
This thesis was also affirmed by Professor Sue O’reilly of the University of Macquarie who suggests that that earth is overlain by a brittle yet cool crust, but underneath is a thick mantel of about 1000 miles thick that continuously mixes with the heat from the molten core of the earth. These viscous blobs of primitive earth material that rise and fall between the mantle and the core, mixing and churning. They form the dynamic energy of earthquakes and volcanoes.
When we start seeing strange phenomenon occurring in the natural world and migrations of birds, mammals and sea animals, then people have to think beyond the conventional scientific thinking and be willing to ask questions. In July 27, 2002, national attention was received when 12 tons of dead and dying jumbo flying squid washed ashore at La Jolla Cove. According to Eric Hochberg, scientist at the Santa Barbara Natural History Museum, “It may have been the largest local mass stranding in nearly 100 years.” It was reported that the squid made strange like a dolphin or a seal as they were dying. One observer states, “The thing that weirds me out about the squid is that they have humanlike eyes.” Known as Dosidicus gigas, the Jumbo Flying Squid live along the middle to northern eastern Pacific Ocean, yet they are now showing up from Orange County down to Baja. This phenomenon is believed by scientists to be related to the unusual heating in different areas of the Pacific Ocean by El Nino.
More and more scientific
study is being done at the core of the earth. This molten core has an inner
iron core about the size of the moon, whose temperatures are more akin to the
heat of the sun. Surrounding it is an outer fluid iron core If
you have ever watched a lava lamp, then you can understand the dynamic inferno
in the center of this earth with the magma convection currents rising and
sinking to the surface and then back as they cool and then reheat. The
outer core of the earth with its smaller diameter spinning 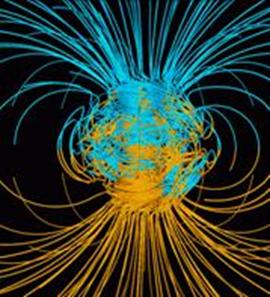 faster causes the rising and falling
magma to twist and spiral like a DNA helical spiral. Understand that this magma
surrounds an iron core that is spinning and as such acts like the copper
windings around an electric generator. Massive electric currents, called
electromagnetic induction, flow between these positive and negative poles and
become the hidden source for the magnetic field that surrounds our earth and
continuously regenerates that field.
faster causes the rising and falling
magma to twist and spiral like a DNA helical spiral. Understand that this magma
surrounds an iron core that is spinning and as such acts like the copper
windings around an electric generator. Massive electric currents, called
electromagnetic induction, flow between these positive and negative poles and
become the hidden source for the magnetic field that surrounds our earth and
continuously regenerates that field.
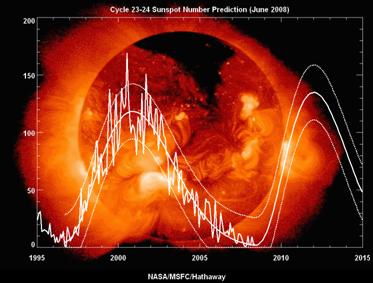
While these mega electrical forces are spinning and rotating in the center of our earth, massive solar storms and bursts of radiation that race out from the sun at the speed of light and travel across the solar system. At the point in time when the magnetic field is at the maximum on the surface of the sun, it forms a complete polar reversal and the north and the south poles of the sun exchange places. The high speed coronal mass ejections, called solar flares, spew out of the sun and in route distort the sun’s magnetic field and as they travel towards the earth, they slam into the magnetic field of the earth, bending, distorting and reshaping the earth’s field. When these massive solar flares pass through the earth it powers up the internal thermal dynamo and fuels further energy currents to rise from the molten core to the surface of the earth. Beneath the bottoms of the oceans, the once cold waters thousands of deep in the trenches are warming. These warm areas, especially in the Pacific Ocean are causing the weather changes across the American continents known as El Nino and La Nina.
Image the earth as a moving solar planet with an iron core and covered with water. What an ideal conductor. As the magnetic fields are moved ad shifted by the external sun flares, it generates electricity in the center of the earth by electromagnetic induction.
How then is heat generated within the earth? The caused of heat are compression by gravity, internal friction, radioactive decay and electrical currents flowing through the earth from the sun. The first three are stable and ongoing forces that are usually uniform in their conduct. The most variable are the electrical currents coming from the sun which increases the electrical voltage through the earth. There are times when the sun undergoes increasing cycles of sunspots and for longer duration. If the sunspots become more pronounced it will affect the inner planetary temperature core.
As the temperature
rises, the spiraling rise of the magma flows will become more intense. This
turbulence underneath the tectonic plates of this earth causes earthquakes to
form and vents in the crust of the earth where volcanoes will erupt. The
heat radiated under the seas and warms up the oceans, causes the polar ice caps
to melt and warms the continental land masses while the glaciers and ice fields
progressively melt. This phenomenon has been  occurring well over a hundred years as
attested by pictures of the receding glaciers at Glacier National Park in
Alaska over the last century. This is global warming totally directed by
the Hand of the Lord.
occurring well over a hundred years as
attested by pictures of the receding glaciers at Glacier National Park in
Alaska over the last century. This is global warming totally directed by
the Hand of the Lord.
A cry has gone throughout the world as the effects of global warming have predictably been affected more and more of the world’s population. The waters in the Great Barrier Reed in Australia were the warmest on record in the summer of 2002. Massive coral bleaching was reported by scientists of the Australian Institute of Marine Science (AIMS). This institute completed an atlas of sea temperatures of the Great Barrier Reef over the past decade and comparing it with historical data showed that 2002 was the warmest water temperatures off northeast Australia since 1870.
Mass bleaching as reported by AIMS showed that on the world’s largest living organism, the barrier reef with 133,300 square miles of coral, over 60% of the reef was affected. “According to Craig Steinberg, AIMS oceanographer, “The outlook isn’t good. If coral can’t adapt then they’re going to bleach and you get mass mortality. These sea creatures live with one to two degree of their maximum temperature threshold and a tiny increase in temperature will result in mass extinction of the entire barrier reef.
Over in American we witnessed the most massive forest fires in Colorado and the western states in 2002 in decades. A year later, in the summer of 2003, we witnessed the highest temperature in England in 350 years in the summer of 2003 when the worse heat wave also in centuries hit France with an estimated 5,000 to 10,000 heat related deaths that caused the political job of more than one French governmental minister.
The hottest summer of 2003 has been getting the attention of scientists. Professor Philip Jones of the climate research unit in University of East Anglia in the UK and Professor Michael Mann of the University of Virginia in American published a recent study in the Geophysical Research Letters supporting the Intergovernmental Panel on Climate Change when they concluded that temperatures date for the last 1,000 years affirm that the 20th century had the warmest climate on record.
Going back to the records in nature, studying trunks of ancient trees, cores drilled in the icecaps of Greenland and Antarctica, and historical records in Netherlands, Switzerland and China, Jones and Mann concluded that the northern half of this planet earth is the warmest since the time of Christ, two thousand years ago.
Atmospheric gases trapped in polar ice has suggested that before the Industrial Revolution, the level of carbon dioxide was 280 parts per million. Modern carbon dioxide readings were first taken in 1958 and in that year the carbon dioxide reading was 315 ppm. By 2002, the level was over 370 ppm. While the world temperature levels do not seem to rise totally parallel with the rise in carbon dioxide, it has become an increasing factor along with solar flares, oceanic cycles and volcanic eruption. The debate continues on how much the populations of the world are contributing to these temperature rises.
Official temperature reading around the world began in 1880. In order to extrapolate temperatures in the past, scientists have used evidence from tree rings and corals, oxygen bubbles in ice plus cores from soil and sediments below the earth’s surface. The evidence generally accepted is that the temperature of the earth since the millennial celebration in 1000 CE, the temperature on the planet has remained constant or possibly cooled a bit. That evidence has now been refuted. In the past 150 years, it has heated up by 1 degree. Why the change and why so fast? Is this another preparation for the time of the end? Is this another way of awaking the world’s populations on the future signs in the natural world that the Lord of hosts will be preparing to herald His coming?
For BibleSearchers, global warming, caused in part by the rise in the burning of fossils fuels in the past century, is now rapidly spinning out of proportion to the human elements involved. Once again we are seeing the finger of the Lord working through the natural forces or the Laws of His Creation.
Increasing we are beginning to understand how the internal dynamic relationship of the core of our earth is affected by the turbulence and upheavals on the sun. The years 2000-2002 saw the apex of one of the most potent of the 11 year solar cycles recorded over the last 120 years. This cycle also depicted a rare double cycle. As the solar flares race from a resurgent sun and slams into the magnetic field of this earth, it energizes the central iron core causing the magma flows to race up to the surface of the earth where under the mantle of this planet the oceans and the continental land masses are warmed.
If the Lord of hosts chooses to extend this cycle and allow the sun to flare with greater intensity, then we will begin to see increased number of earthquakes and volcanic activity. These are the natural forces, under the control of the Hand of the Lord, that broke up the continental plates, displaced the ocean floors and caused the mountain ranges to rise. As the land masses rise and fall, the shifting weight will some day cause rotational imbalance to this earth. As the earth begins to wobble more and more, the day will come when we will see a complete polar reversal.
Predicting Earthquakes
The goal of earthquake prediction is to give warning of potentially damaging earthquakes early enough to allow appropriate response to the disaster, enabling people to minimize loss of life and property.
Assumption of Random Occurrence: Scientists study the past frequency of large earthquakes in order to determine the future likelihood of similar large shocks. This is called the assumption of random occurrence.
For example, if a region has experienced four magnitude 7 or larger earthquakes during 200 years of recorded history, and if these shocks occurred randomly in time, then scientists would assign a 50 percent probability (that is, just as likely to happen as not to happen) to the occurrence of another magnitude 7 or larger quake in the region during the next 50 years.
Clustering of Earthquakes: The clustering of earthquakes leads scientists to estimate that the probability of a magnitude 6.8 or larger earthquake occurring during the next 30 years in the San Francisco Bay region is about 67 percent (twice as likely as not). This clustering is when strain is released along one part of the fault system; it may actually increase on another part.
For example, four magnitude 6.8 or larger earthquakes and many magnitude 6 - 6.5 shocks occurred in the San Francisco Bay region during the 75 years between 1836 and 1911. For the next 68 years (until 1979), no earthquakes of magnitude 6 or larger occurred in the region. Beginning with magnitude 6.0 shocks in 1979, the earthquake activity in the region increased dramatically; between 1979 and 1989, there was four magnitude 6 or greater earthquakes, including the magnitude 7.1 Loma Prieta earthquakes.
Accumulation of Fault Strain: Another way to estimate the likelihood of future earthquakes is to study how fast strain accumulates. In the United States, only the San Andreas Fault system has adequate records for using this prediction method.
For example, for the past 150 years, earthquakes of about magnitude 6 have occurred an average of every 22 years on the San Andreas Fault near Parkfield, California. The last shock was in 1966. Because of the consistency and similarity of these earthquakes, scientists have started an experiment to "capture" the next Parkfield earthquake.
Will America be involved in future Time of the End Quakes?
 For decades, California has been
expecting the “Big Quake”. In the mid 1970’s while I was a student there
was at least one Christmas we deliberately delayed our return to California
because of a prediction of the big one in early January.
For decades, California has been
expecting the “Big Quake”. In the mid 1970’s while I was a student there
was at least one Christmas we deliberately delayed our return to California
because of a prediction of the big one in early January.
To the side is a graph map of southern California earthquakes.
Major southern California earthquakes over the last 75 years (Coming Earth Changes, p69)
With the San Fernando quake in 1971, we were always reminded that life could be very tenuous. Now with our son in college about 30 minutes from Redlands, California, my interest in obviously increased.
San Andreas Fault and Southern California
California’s major San Andreas Fault is known to be the boundary zone between the Pacific and North American tectonic plate. In other words, the coastline of California and especially Los Angeles and San Diego are not on the North American land plate but actually part sitting over the Pacific land plate, which is subducted or riding under the western edge of the North American plate. A non-verified story was told to me about a friend of his, who was part of a submarine exploration under the North American Plate along the California coast. This sub exploration upward to 50 miles inland before the North American plate and the Pacific plate fully came together.
If these plates were to separate, your imagination is just as fertile as anyone else’s in knowing what will happen to these major cities. There is no doubt that the seismic activity has increased significantly in the 90's. This trend is concerning to seismologists because it parallels the cycle of quakes that came before the noted 1906 San Francisco earthquake.
A sudden acceleration in the grinding between the two plates has been documented. The Northridge Quake in 1994 occurring along a small fault was the first quake to strike urban U.S. since 1933 and the worse financial loss ($13-20 billion) since 1906. If San Andreas Fault east of Los Angeles began to slip, 10 million people would be affected. The occurrence of a big quake at Wrightwood, California averages about 100 years. Yet, this fault has been very quiet for over 135 years. Several 7M quakes or one big 8+M quake could suddenly release this stored stress.
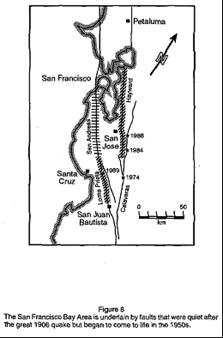
The Faults in the San Francisco Bay Area (Coming Earth Changes, p.75)
Though San Bernardino-Loma Linda-Redlands with 3 million people would be the most affected, earthquake swarms would radiate towards Los Angeles basin, which sits on a cluster of dozens of faults radiating in all direction. This land mass area could suddenly break up and collapse like putty, underneath the city of L.A, and the city would disappear like in a sinkhole.
San Francisco and Northern California
This area has been seismically quiet since the 1906 earthquake. Thirty years ago this began to change with the 1990 7.1M Loma Prieta quake originating in the rural Santa Cruz Mountains. Three faults traverse this area: the San Andreas Fault, the Hayward and the Calaveras Fault. 7M plus quakes usually coming in pairs within the major population areas would create significant deaths and devastation.
The Pacific Northwest, the Tectonic Plates and the Cascade Volcanoes
Pacific Northwest Plates (Coming Earth Changes, p.80)
This coastline from Vancouver Island, British Columbia to northern California is formed by the subduction under the North American Plate by the Juan de Fuca Plate and the Goda Ridge Plate just off the coastline of this area. Earthquake projections are for several 8 plus quake or one 9 quake with the next 30 years.
This would create two big hazards along with the primary quake damage. In that the quake would be generated off the coast in the Pacific, tsunamis with estimated waves of 35 plus feet would slash into the coastline. Seattle which sits on a sandy shelf at sea level would be devastated.
 The second big hazard from earthquakes
is volcanoes. There are seven active volcanoes besides Mount
St. Helens which erupted in 1980, in the Cascade Mountain Range. These
include Mt. Baker, Glacier Peak and Mt Rainer in
Washington; Mt. Hood, in Oregon; and Mt. Shasta, Cinder Cone, and
Lassen Peak, in California. The explosion of volcanoes would
be one hazard, but a collapsing mountain such as Mt. Rainier could sweep
through low areas with avalanches and mudflows where 100,000 people now reside.
Most of you remember the explosion of Mt. St. Helens. By historical
standards, this was a small volcano as noted in the following graph.
The second big hazard from earthquakes
is volcanoes. There are seven active volcanoes besides Mount
St. Helens which erupted in 1980, in the Cascade Mountain Range. These
include Mt. Baker, Glacier Peak and Mt Rainer in
Washington; Mt. Hood, in Oregon; and Mt. Shasta, Cinder Cone, and
Lassen Peak, in California. The explosion of volcanoes would
be one hazard, but a collapsing mountain such as Mt. Rainier could sweep
through low areas with avalanches and mudflows where 100,000 people now reside.
Most of you remember the explosion of Mt. St. Helens. By historical
standards, this was a small volcano as noted in the following graph.
Selected Historical Volcano Eruptions. (Coming Earth Changes, p.82)
California is not the only earthquake prone areas in the United States. There are several significant faults within the Utah and Nevada states. The Wasatch fault zone lies near the Grigham City-Salt Lake City - Ogden urban area with one million people.
This fault has about ten segments of some 9 to 36 miles in length. The historical Major Fault Zones in Utah and Nevada data show the occurrence of 6.5 to 7.5quakes.
Coming Earth Changes p.85
Not only is there significant property damage potential, but it also includes Tooele, Utah, the home of the U.S.’s largest stockpile of chemical weapons.
In southern Nevada the fault extends into the region of Las Vegas, also with significant building property but also includes Hoover Dam and the Yucca Mountain high level waste repository.
On August 27, 2003, a
rare 4.4 magnitude earthquake occurred nine miles south of the
south entrance to Yellowstone National Park. The park authorities
have been watching closely increased hydrothermal activity at the Norris Geyser
Basin and increased hydrothermal activity under Yellowstone lake. This
quake, being very shallow according to Park official has vaulted the volcanism
model developed by Larry Park towards a worse-case scenario. “Simply put,
anyone living within 600 miles of Yellowstone could be sitting in a modern day
Pompeii. In addition, for  those living outside this area and
west of the Mississippi river, there could be grievous consequences as well
because systemic processes are now building beneath Yellowstone, that paint a
very clear picture of a major eruption event in its early stages.”
those living outside this area and
west of the Mississippi river, there could be grievous consequences as well
because systemic processes are now building beneath Yellowstone, that paint a
very clear picture of a major eruption event in its early stages.”
Earthquake Zones at the western home of the Nuclear and Chemical Stockpile Storage Facilities - Coming Earth Changes p.85
Significant scientific concern has now been expressed as the evidence is becoming more and more clear, the subterranean thermal vents beneath Yellowstone National Park are getting hotter. Overall the water in the Yellowstone basin is getting hotter. Norris, the park’s hottest and most active geyser basin with its hot springs and brilliant colored thermal pools is spewing higher and more active steam vents than ever before.
Steamboat geyser, known as the largest geyser in the world, whose routine activity is dormant upwards to 50 years as spouted four times this year. The temperature in Pork Chop geyser has risen 8 degrees Celsius in the last few months. Increased swarms of earthquakes are occurring and new vent cracks are breaking forth.
All this activity is heating up the scientific discussion about the relationship between the recent activity in the park and the erupting magma flows miles in the depths of the earth. Yet, what we cannot see in the interior of the earth, we can perceive on the surface.
Yellowstone Volcano Alert – August 2003
New radar technology is now able to measure minor movement in the crust of the earth. It can watch, in the case of Yellowstone, the breathing or the ups and down movement of the land. In the last seven years a 28 by 7 miles area south of Norris has bulged 5 inches in the last seven years. This is very rapid in geological time. This has now brought a third unknown “resurgent dome” in the Yellowstone ancient volcanic caldera whose up and down puffing movement is indicative of the underground movement of thermal water flows and magma.
Major southern California earthquakes over the last 75 years (Coming Earth Changes, p69)
How interconnected the subterranean world of magma, tectonic plates and expanding and contracting crustal surfaces of the earth was recently depicted when a recent earthquake in Alaska set off hundreds of earthquakes in Yellowstone the next day and set the bay swelling and pulsing at Clear Lake near Houston, Texas within hours.
The Central and Eastern States
Within the central and eastern states are eight known fault zones. Only one, the New Madrid
Seismic Zone has demonstrated the capacity for large earthquakes. Though there have not been
any quakes greater than 5 in this century, in the 1811-1812 era, 2000 quakes were generated in
 this area. This included about 5
in the 8 plus magnitude, 15 quakes in the 6.5-7.8
this area. This included about 5
in the 8 plus magnitude, 15 quakes in the 6.5-7.8
Magnitude. If this were to be repeated, the cities of Memphis and St. Louis would be devastated.
Earthquake Source Zones in Mid America (Coming Earth Changes p.91)
Seismologist have placed the fault zones with the greatest threat to land and population as
(1) New Madrid Seismic Zone,
(2) St. Lawrence Valley Seismic Zone,
(3) the Charleston, S.C.area,
(4) the Cape Ann, Mass area and
(5) the Wabash Valley Fault Zone.
One other fault of significance is the Eastern Tennessee Seismic Zone. This area causes more seismic activity than any other area in mid to Eastern U.S. except the New Madrid Fault Zone. Along this zone also run several hydroelectric power plants, two nuclear power plants and Oak Ridge National Laboratory.
The Eastern North Atlantic Seaboard
New York City and the eastern Seaboard have been placed in several end of times prophetic models including visions by Ellen White. Stanford and USGS scientists have found evidence that stresses have been building in the last 100 years in the upper crust of western
Long Island and the northern part of New York City. The 1884 quake of about 5 magnitude was located near the mouth of the Hudson River. The fault that came from that quake runs through Central Park, Manhattan and Greenwich Village.
Great earthquake motion intensity map for 8.0 to 8.9 Quakes
(Coming Earth Changes p.95)
On April 20, 2002, a rare 5 M earthquake rocked the northeastern part of the United States as it
radiated from a fault a little over two miles under the earth’s surface, fifteen miles southwest of
Platsburgh, New York.
The last recorded earthquake was a magnitude 5.1 event in 1983 in the Blue Mountain Lake area, New York. The largest historic earthquake in the northeastern region of the U.S. and Canada occurred near Charlevoix, Quebec in 1663, 200 miles to the northeast.
Also northeast in New Jersey in the Ramapo Fault Zone, evidence has been found, according
to evidence in radiocarbon dating of basal peat bogs, of not only sinking but in rotating the crustal blocks within the zone. This scenario could occur below New York City area and a similar condition would occur in the Cape Ann Fault, which would cause significant damage to Boston, Massachusetts.
Tsunamis (Tidal Waves)
Facts about Tsunamis
Tsunamis are seismic sea waves. Their name is a Japanese word meaning ‘harbor waves’. They are often incorrectly called ‘tidal waves’ (rare events linked to tides). A tsunami is a series of traveling ocean waves of extremely long length and period. They are caused by under-sea events
like earthquakes, landslides and volcanic eruptions; or by other natural events such as ocean meteorite impacts, or large landslides into bays or lakes. (The effect in a lake is known as a ‘seiche’).
A tsunami is like the effect of a stone landing in a pond. Waves radiate out in ever-widening circles. As a tsunami crosses a deep ocean, length from crest to crest may be 150 km (50 miles) but the height may be under a meter (3 feet), unfelt by ships nor seen from the air, and may reach speeds up to 1,000 km/h. (600 mph) The waves’ energy extends from deep ocean floor to surface.
Effects on Coastal Regions
As tsunamis enter shallow water near coastlines, wave speeds drop as energy is compressed into much shorter distances. Wave heights increase dramatically up to 40 meters (120 plus feet), threatening life and property, as they strike the shore with devastating force (see diagram). Between multiple waves, which may vary in size, sea-level may actually drop well below normal. Great destruction may arise even though the tsunami may have been caused thousands of miles away.
Where Do They Occur?
Pacific Region - The majority of tsunamis occur in the Pacific Ocean, although they have occurred in all oceans of the world. In our region, areas most at risk include many Pacific Islands, New Zealand, and the heavily-populated coasts of Japan and Indonesia.
Australian Occurrences - On average, a tsunami is recorded in Australia every two years, but most are too small to be seen by people. The tsunami threat to Australia varies from ‘low’ for most of the continental coastline to ‘medium’ along the northern half of WA (see map, page 27). A small one struck WA in 1994.
In the 1980s a tsunami reached Darwin at low tide, which fortunately cancelled out most of its force. Evidence also exists of large tsunami impacts on the south-east coast, but before European settled on the continent. The largest actually recorded in Australia was in August 1977 at Cape Leveque , WA, with a ‘run-up’, or traveled up the beach and land 6 meters (19 feet) above sea level.
History of Tsunami Disasters
The worst tsunami disaster followed the volcanic eruption of the island of Krakatoa in 1883 when 35 meter (115 foot) waves crashed into Java and Sumatra, drowning 36,420 people.
In 1896, a large tsunami killed 27,000 in Japan. In May, 1960, an earthquake (9.5 Mw) off the coast of Chili, generated waves in the deep water of the Pacific that traveled a full 150 degrees around the globe, or more than 10,000 miles, landing ashore in Japan with a 15 foot tsunami. Altogether it killed 1,000 people in Chile, Hawaii, the Philippines and Japan.
From 1970 to 1997, tsunamis caused over 9,000 deaths, including 2,700 on the Indonesian island of Flores in December, 1992. Computer projection states that a 30 foot asteroid impact between Australia and New Zealand would generate a tsunami which would impact southern Japan with 125 to 175 foot wave.
Volcanoes in the United States
When the continental
plates begin to move, the tsunami and volcanoes emerge or erupt. Neither 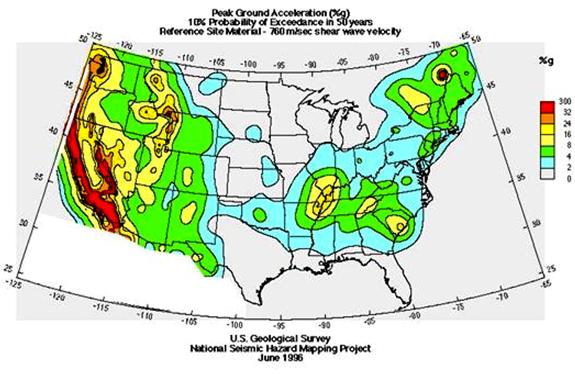 one can exist without the evidence of
earthquakes. What an area of fascination, especially for children, for
volcanoes web sites on the Internet are amongst the most popular sites to date.
one can exist without the evidence of
earthquakes. What an area of fascination, especially for children, for
volcanoes web sites on the Internet are amongst the most popular sites to date.
The United States, next to Japan and Indonesia, has the most potentially active volcanoes in the world, 68. Most volcano sites are in Alaska and Hawaii, the most famous; Augustine Volcano and Mona Loa, yet 20 sites are known in the contingent United States.
The University of Buffalo scientist studying ice cores that discovered a mystery in relation to global climate change and solar activity and sunspots. In their studies, it showed that volcanic eruptions have now been observed to interfere and reverse the effect of sunspots on global climates. Most of the studies on global warming have been centered on the effect of human interference on atmospheric changes in the climate.
Two different mechanism that effect the climate are the cosmic ray and charged particles that stream towards our earth. According to Michael Ram, Ph.E., professor of physics at UB claimed that it was the goal to find out if “periods of maximum sunspots will influence the climate to behave in a certain way. Many times scientists would find a trend between the sun and the climate then suddenly this trend would reverse. So the students started studying the dust concentrations in ice cores from Greenland which give a “past-atmospheric dust concentration.” Since dust is a very sensitive marker of dry climate changes they began to co-relate the ice cores for the past 300 years with laser-light scattering techniques with sunspot data that has been recorded for also the same 300 years.
What they found were 32 years of positive sun/dust correlation, but it was also in the years that there was relatively little worldwide volcanic explosive activity. Every one of these ‘quiet” periods came to an end with increase volcanic explosions. The assumption was that low level of cosmic ray on the Earth came from high sunspot activity. This would give less cloud cover, less rain and high dust levels.
Then came the Indonesian volcano Krakatau that erupted in 1883 and killed 36,000 people worldwide. The normal sun/dust correlations, between 1860 to 1882, which were ‘quiet periods’ in the atmosphere came to a complete halt. Six major volcano eruptions, between 1800 to 1962, showed the same reversals between sunspot and climate. So here we have increased solar flares and activity causing less clouds, less rains and more dust yet, more volcanoes adding more dust and sulfates in the air also increase the dust levels. Where sunspots decrease cloud cover, volcanoes increase cloud cover.
American and the Pacific Northwest Volcanoes
The most prolific site of past, present and potentially future volcanic activity in the continent United States is the Cascade Volcanic region in the Pacific Northwest: Washington, Oregon and Northern California. Here the Juan de Fuca plate, part of the larger Pacific plate, is cramming itself under the lighter North American plate. How fast? About an inch and one-half a year. Deep under the surface, the compressed and heated rocks melt into magma, ascending like blobs to the surface. They are then stored in chambers, gradually developing pressure until the lid blows off and the volcano erupts. Out pours the lava, gas, ash, steam and molten rocks.
It is Mount St. Helen’s that is most familiar to the American public, for she is the only volcano to erupt since 1950. In 1980, she erupted, killing 56 people and leveling enough trees to build 300,000 homes. Yet Mount St. Helen’s is only one of 13 of the 20 known volcano site in the contingent U.S., all of which are potentially active volcanoes in the Cascades mountain range. Eleven of these sites have erupted according to vulcanologists in the past 4000 years, seven in the past 300 years. These 13 include:
1. Mount Baker – dormant for thousands of years, erupted in the mid 1800’s and has active steam vents near the summit in Sherman Crater.
2. Glacier Peak – erupted at least 6 times in the last 4000 years.
3. Mount Rainer - the most unstable and most dangerous.
4. Mount St. Helens – the most recent eruption in 1980.
5. Mount Adams – minor eruption 1000 years ago.
6. Mount Hood – last erupted 200 years ago with widespread flowing rivers of fire and mudflows.
7. Mount Jefferson –
8. Three Sisters, Newberry Volcano, Crater Lake, Medicine Lake Volcano,
9. Mount Shasta – California’s most active volcano who has erupted about every 300 years.
10. Lassen Peak – erupted in 1914-1917 with 6.4 miles of volcanic debris.
The KTT (Kermadec Tonga Trench)
The main pressure points are the KTT area along the Australian and Pacific Plates and the Caribbean Plate pointing towards the Mid-Atlantic Ridge. The main sliding areas are the Indonesian, Indian-Himalayan, and Peri-Mediterranean area.
The most active region the world in terms of earthquake activity is an area northeast of New Zealand called the KTT or the Kermadec Tonga Trench. It is this area, I feel that watchers of natural signs must keep a close look, for this area appears to be an early warning area of seismotectonic activity for the whole world. When massive earthquake and volcanism is observed in this area, especially in the deep plates, then a major chain reaction may ensue.
Between the Kermadec Islands and the Tonga Islands, is what is known as the Monwai Seamount, about 750 miles NE of New Zealand. Whereas the Tonga and the Kermadec Trenches are from 5.5 to 6.5 miles in depth, the Monwai Seamount is relatively shallow as 2.4 miles in depth. This uplift is the result of volcanic uplift.
Closer to New Zealand in the Bay of Plenty is a 1050 foot, emerging submarine volcano, call White Island. It is about 10 x 12 miles in size consisting of two overlapping strato-volcanoes. In the years between 1996-1999, intermittent activity has been monitored here with steam and tephra eruptions. It is this summit that forms a part of the famous legends of the Maori tribesmen.
On the North Island off of New Zealand, is a 9100 foot summit, Ruapehu, which is one of the most active volcanoes in the region. This strato-volcano has at least four cone building areas and one active vent, Crater Lake. This area, I believe is an area to be watched with great interest.
Mount Etna and the Callabria region of Italy
Almost directly opposite
the South Pacific area of the KTT is one of the next most unstable regions of
the earth’s globe. It might be regarded as an antipodal region of the
KTT region in the South Pacific, because it is on the opposite side of the
earth’s crust. In the Mediterranean area, Mount Etna towers above
Catania, in the northeastern part of the island of Sicily, and the Callabria
area of Italy. This region marks the boundary zone between the African
and Eurasian crustal plates. Earthquakes along this zone are known as strong,
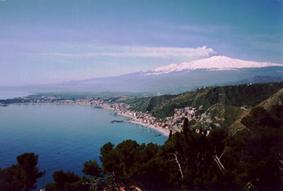 deep-focus earthquakes.
Mount Etna (37.73 degrees N, 15.00 degrees E, summit elev. 10,870 feet) has one of the longest documented records of volcanism in historical times and is the highest volcano in Europe. During historical times, it has erupted about every six years, yet since 1958 the volcanic output has increased significantly, the most in 300 years and has the longest duration of volcanism of any volcano, a total of 472 days. Violent eruptive activity has been increasing in the especially since 1993 with both the Etna and Stromboli volcano simultaneously erupting, Etna with three craters erupting and Stromboli with four craters erupting.
Etna has the longest history of eruptions, beginning in 1500 BC when it was first recorded and has had 190 eruptions since then. The largest eruption was in 1669 when lava flows destroyed parts of the town of Nicolosi six miles away. Current activity is about one sixth the rate of Kilauea in Hawaii.
Hutton, William, Coming Earth Changes, ARE Press, Virginia Beach, VA, 1996.
Mount Etna, Moses and the Exodus of the Israelites
 What it of interest is that Mount Etna
was one of several volcanoes who erupted in that famous era of 1500 BC.
The most famous being the powerful explosion of the island of Thera (Thira
also called Santorin or Santorini) the southernmost island in the
archipelago of the Cyclades in southern Greece. This is the most powerful
volcanic explosion recorded in the last 3500 years. The island of Thera
was about ten miles in diameter and estimated at 5,200 feet high and its eruption
destroyed the highly civilized Minoan civilization. Also at this
time, according to geologists, the eastern margin of the Sinai Peninsula
underwent a major uplift. The tephra (ash) blew across the Mediterranean
towards the New Kingdom of Egypt and the 18th Dynasty reign of
Amenophis II and his descendents.
What it of interest is that Mount Etna
was one of several volcanoes who erupted in that famous era of 1500 BC.
The most famous being the powerful explosion of the island of Thera (Thira
also called Santorin or Santorini) the southernmost island in the
archipelago of the Cyclades in southern Greece. This is the most powerful
volcanic explosion recorded in the last 3500 years. The island of Thera
was about ten miles in diameter and estimated at 5,200 feet high and its eruption
destroyed the highly civilized Minoan civilization. Also at this
time, according to geologists, the eastern margin of the Sinai Peninsula
underwent a major uplift. The tephra (ash) blew across the Mediterranean
towards the New Kingdom of Egypt and the 18th Dynasty reign of
Amenophis II and his descendents.
NASA Sir-C image of Etna’s Summit craters
Does it surprise us that this event also coincides with the dramatic Exodus of the Children of Israel, in which many of the ten plagues can be related to recent volcanic explosions. Traversing across the Sinai, we also see the Israelites camping about a loud, venting, thunderous volcano, Mount Sinai, when the Tables of Stone were given to Moses. Imagine walking in and out of a peninsula of one smoking cauldron and crater after another, and you can imagine the fear and temerity of the Israelite people.
This one volcanic
explosion, or you might say a clustering of explosions from Mount Etna to Thera
or Santorini then across the Sinai lava beds to Mount Sinai was felt at least
from China to Greenland. G.M. Friedman, in Geotimes (March
1992) stated that ash (tephra) was carried all the way to China and the records
of that era record the deleterious impact on agricultural 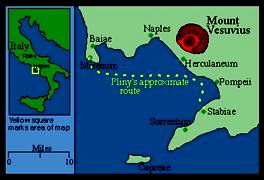 production, which included the dimming
of the sun, famine and crop failures. On the opposite side of the globe,
the ash is recorded in the Greenland ice cores.
production, which included the dimming
of the sun, famine and crop failures. On the opposite side of the globe,
the ash is recorded in the Greenland ice cores.
Mount Vesuvius near Naples, Italy
Near Mount Etna is
another volcano, I have on my watch list, Mount Vesuvius, near Naples,
Italy. Mount Vesuvius (40.82 degree N, 14.43 degree E, summit elevation
1281 m) is most famous with its 79 AD eruption, which destroyed the ancient
cities of Pompeii and Herculaneum. Another significant explosion occurred
in 1631 and 1760. The last cycle of activity ended about 1944. 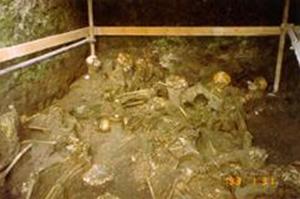 Compare this date with the number of
earthquakes on the century list above. Recently it has portrayed itself
with moderate seismicity and intracrater fumarolic activity in the Somma
caldera.
Compare this date with the number of
earthquakes on the century list above. Recently it has portrayed itself
with moderate seismicity and intracrater fumarolic activity in the Somma
caldera.
Vesuvius victims in a boathouse on the shoreline at Herculaneum
Nine years after the destruction of the Jerusalem and the Temple of Herod, one of the greatest disasters occurred in natural history. The ancient cities of Pompeii and Herculaneum were completely destroyed. The area today around Mount Vesuvius is the world’s most densely populated area of any volcanic region. According to Edoardo Del Pezzo, a research professor at the Vesuvius Observatory in Naples said, “We expect that a wide area could be destroyed in minutes.
Recreation of the 79 CE
explosion of Vesuvius shows the following scenario. In a Newsweek article
by Barbie Nadeau, it states, “Twenty thousand residents of Pompeii and
Herculaneum thrived on the mountain’s unusually rich soil, which they 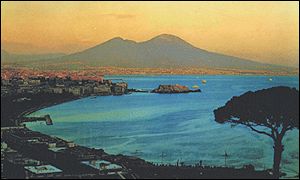 probably
attributed to the blessings of Fauna, the goddess of farming and fertility. In
August of that year the gods got ugly. Wells dried up, mountain streams stood
still, birds and dogs went silent, the ground rumbled. One day hot gases, ash
and pumice shot 30 kilometers into the sky. Ash rained down on Pompeii at the
rate of six inches per hour, and then came the lava.”
probably
attributed to the blessings of Fauna, the goddess of farming and fertility. In
August of that year the gods got ugly. Wells dried up, mountain streams stood
still, birds and dogs went silent, the ground rumbled. One day hot gases, ash
and pumice shot 30 kilometers into the sky. Ash rained down on Pompeii at the
rate of six inches per hour, and then came the lava.”
In reference to the discussion above on the Earth’s Earthquake Machine, Italian and French researcher discovered that five miles below Mount Vesuvius is a massive layer of spiraling magma that stretches from Vesuvius to the Phlegraean Fields below Naples. This magma plume was reported to be 145 square miles in 2001.
It reminds us of the prophecy of Edgar Cayce.
Edgar Cayce – “There will be upheavals in the Arctic and in the Antarctic that will make for the eruption of volcanoes in the torrid areas, and there will then be the shifting of the poles so that where there have been those of a frigid or semi-tropical will become more tropical, and moss and fern will grow.”
Mount Pelee and the Caribbean Plate Point
Mount Pelee (14.82
degree N, 61.17 degree W, summit elevation 1397 m) is on the island of
Martinique in the West Indies. It is the most active volcano in the
Lesser Antilles arc. In the past 5000 years, according to 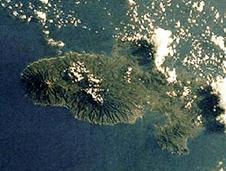 vulcanologists, there are been more
than 20 major eruptions. Looking on the maps of major plates, we see it
at the eastern edge of the Caribbean Plate as it juts into the Mid-Atlantic
Ridge. As we now know, this area is expanding or widening. The
problem is that the western edge of the Caribbean plate hits the must larger
Pacific Plate. In other words, it is getting the ‘big squeeze’.
vulcanologists, there are been more
than 20 major eruptions. Looking on the maps of major plates, we see it
at the eastern edge of the Caribbean Plate as it juts into the Mid-Atlantic
Ridge. As we now know, this area is expanding or widening. The
problem is that the western edge of the Caribbean plate hits the must larger
Pacific Plate. In other words, it is getting the ‘big squeeze’.
The l’Etang Sec summit crater has two lava domes put in place during the 1902 and 1929 eruptions. Earlier we talked about the first eruption which killed 29,000 people in the city of St. Pierre, and marked the beginning of volcanological studies in the behavior of pyroclastic flows.
Seismicity studies began in 1985 and 40 events have been recorded up till June 4, 1999. Due to location, I have placed this volcano on my watch list for both earthquake and volcanic activity. It also serves as an early warning system of deep tectonic and crustal shifting activity.
Largest
Explosive Eruptions Since 1400 AD
VEI Greater Than or Equal to 5
|
Volcano Aniakchak |
Country USA-AK |
Date 1450C |
VEI 5? |
Type of Volcano Caldera |
Modified from Table 3 in Newhall, CG, and S Self, 1982, The volcanic explosivity index (VEI) is an estimate of explosive magnitude for historical volcanism: Journal of Geophysical Research87, 1231-1238.
Let’s take a closer look
at the beautiful and one the most picturesque volcanoes in Washington, Mount
Rainer. Two 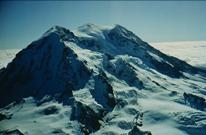 hundred years it has been a landmark
of serene beauty. Yet within its core the rocks are crumbling and
weak. This combination with its tall peak with steep sides, weak and
loose interior held together only by gravity and one cubic mile of glacier ice
makes this mountain of beauty one of the most dangerous volcanoes in the
world.
hundred years it has been a landmark
of serene beauty. Yet within its core the rocks are crumbling and
weak. This combination with its tall peak with steep sides, weak and
loose interior held together only by gravity and one cubic mile of glacier ice
makes this mountain of beauty one of the most dangerous volcanoes in the
world.
Mount Rainer in Washington State
Mount Pelee in the Caribbean Martinique, was a similar volcano which erupted in 1902 in which a giant pyroclastic flow of 1,300 degrees Fahrenheit of molten rock, ash and gas raced with potential speed up to 80 miles per hour sweeping into the town of St. Pierre, killing 29,000 people.
So also, Mount Rainer, could also either blow or flow, or both. Tall volcanoes, like Etna, Vesuvius, Mount St. Helens and Mount Pinatubo (Philippines) are usually explosive volcanoes. It was Mount Pinatubo, who in 1991 spewed 15 million tons of ash, rock and sulfuric acid 22 miles into the stratosphere. If this material had fallen on New York City, it would have buried the city under 1000 feet of debris, leaving only a few skyscrapers sticking out the top.
When Mount Rainer blows and erupts, cascading avalanches will destroy the area 10 miles around with mudflow, lahars, will flow down the valleys for fifty miles all the way to Seattle and inundating at least 14 towns and cities, including, Tacoma, Auburn, Ashford, and Seattle. (“America’s most dangerous Volcano, Discover, November, 1999, p.83-89)
Within the state of California is evidence of 75 volcanic vents during the recent history with at least 500 vents noted in geological time. At least 10 of these have erupted in the past 600 years, an era of uniform placidity. These include Mount Shasta, Lassen Peak, Cinder Cone, the cluster of volcanoes in Medicine Lake Highland and the Mono-Inyo volcanic chain.
Prophetic Watchers at the End of Times
Revelation 6: 12-17 - And I beheld when He has opened the sixth seal, and lo, there was a great earthquake; and the sun became black as sackcloth of hair , and the moon became as blood; and the stars of heaven fell unto the earth, even as a fig tree casteth her untimely figs, when she is shaken of a mighty wind. And the heaven departed as a scroll when it is rolled together; and every mountain and island were moved out of their places.
Using modern day geological data, we must consider seriously the following. Major crustal shifting will occur first in the deep tectanic plates starting in the KTT region of the South Pacific, with antipodal activity on the other side of the world at the Eurasian-African plate junction at Mount Etna and Vesuvius. The Pacific Plate pressure will then exert significant force against the Caribbean plate which points into the Mid Atlantic Ridge area. At this junction, Mount Pelee will begin major volcanic and seismic activity.
At this time, it is my expectation that we will then see major unprecedented seismic activity on the west coast of the United States with the San Andreas Fault sustaining significant activity. Catastrophic losses in human life and societal destruction will spell the beginning of a major rearrangement of the United States. According to geological futurists, the subduction of the central California valley will bring the return of an inland sea formerly seen in ancient times. Then mid American will possibly see a major rift where the Great Lakes will empty into the Gulf of Mexico, and the eastern seaboard will suffer catastrophic losses in the disappearance and subduction of most notably at New York City and surrounding region.
How does this affect the prophetic watchers of future end times events. With worldwide earthquakes, we know that worldwide volcanism will erupt. The tectonic places of the continental plates will shake, separate, collide and collapse. The darkened sun, the moon turned to blood, the darkened day are all signs of extreme volcanic activity. We will also see in a few moments that, tilting of the earth’s poles, slowing of the earth’s orbit, sliding of the earth’s crust, increasing solar flares and novas, the earth loosing her geomagnetic shield, and the most ominous of all, comets and asteroids colliding unto our earth, all weave a complex fabric into the events at the end of time.
What about the Land of Israel. Scientists are prediction that a major earthquake could happen any time in the near future. Yaacov Heichal is the chairman of the steering committee that works with the ministerial committee on earthquake preparedness. As Heichal has stated,
Yaacov Heichal - “Our main assumption is that there will be a major quake in this area about every 80 – 90 years. The last one was in 1927. Jerusalem was affected that time, along with Nablis and Jericho and, to some extent, Lod and Ramle. The last major quake before that was in 1837. That time, the epicenter was in the north: the Galilee, the Beit She-an area, Safed. The data shows that there were 3,000 deaths – basically, that was the population of that area at the time. Since nothing has happened in the last 70 – 80 years, the risk is growing.”
When the scientists of Israel are talking about earthquakes, they are talking about a major quake. Annually there are 4000 quaked in Israel in the magnitude of 4-5. A major quake above a magnitude of 6-7 does cause structural damage to building and the resultant loss of life. Dr. Avi Shapira is the director of the Seismology Division at the Ministry of Infrastructure’s Geophysics Institute. “An earthquake is, chronologically , a random phenomenon. There’s no such thing as an earthquake happening every 80 to 90 years.” Yet he does agree that an earthquake can happen at any moment. Probability calculations state that within 50 years the probability of an earthquake is very high because the accumulated energy will have to be released from the tectonic plates below Israel.
On Divine Judgments at the End of Times
On the chemical and nuclear weapons industry.
Nuclear Age has brought a very interesting form of evil upon the earth, contamination that will last thousands of years. Biblical authors have suggested that the scanty remains seen of pre-flood civilization is that God buried these ante-diluvium remains deep in the earth because of the serious departure from the commands of God. This included violation of the laws of genetics and possible laws of thermodynamics. Did the ancients have access to nuclear weapons? This we do not know.
Considering that we now have 1200 metric tons of Plutonium and unknown quantities of Uranium 235 and 238, which exist stored in storage facilities or bombs, the United States are one of the greatest producers and storage facilities of nuclear material.
Main sites nuclear storage and waste deposits in the United States.
Oak Ridge National Lab – Oak Ridge, Tenn.
One million curies radioactive cesium/strontium injected underground
2 nuclear power plants and several hydroelectric plants
Area of subsidence in the East Tennessee Seismic Zone
Savannah River Plant, George
900,000 curies radioactive solution mixed fusion into streams and ponds.
Major area of subsidence if the East Tennessee Seismic Zone.
Hanford Plant, Richland WA
700,000 curies mixed fusion into soil and surface ponds
Pacific Northwest Earthquake and Volcano Zone
Nevada Test Site – south Nevada – NW of Los Vegas
Above and below ground nuclear test site which include huge quantities of plutonium
and cesium – total 1041 test explosions
Near the Utah-Nevada Earthquake Zone
Lawrence-Livermore National Lab – Lawrence. CA
Major testing for SDI
Major weapons and design facility
In Northern California, east of the Calveras and Hayward Fault near San Francisco
Nuclear Weapons and Production Facilities
Three Weapons Lab:
Sandias National Lab – Albuquerque, NM
Los Alamos National Lab – Santa Fe, NM
Major weapons and design facilities
Area of uplift and mountains – fault zones certain
Near the southern region of the Rocky Mountain uplift zone
Lawrence-Livermore National Lab – Lawrence. CA
Nuclear Weapons Production Complexes
14 Production reactors in Washington State and South Carolina
In the Pacific Northwest Seismic and Volcanic Zone
South Carolina – Major subsidence Zone east of East Tennessee Seismic Zone
Eight Separation and Reprocessing Plants and 239 underground storage tanks for
high level radioactive waste - Washington Idaho and South Carolina
Near the Pacific Northwest Earthquake and Volcano Zone
Plutonium Storage Facility - Rocky Flats, Colo - Tons of machined plutonium for
nuclear weapons – 16 miles from Denver proper.
Located in the major uplift zone of the Rocky Mountains
Yucca Mountain Nuclear Waste Repository Site
Waste Repository Site near Los Vegas
Near the Utah-Nevada Fault Zone
Chemical Weapons Storage Site
Tooele, Utah, home of the large storage facility site
Near the Utah-Nevada Fault Zone and the East Tennessee Seismic Zone
Let us re-look at two texts concerning the end of times.
Revelation 11:13 - “And the same hour was there a great earthquake, and the tenth part of the city fell, and in the earthquake were slain of men seven thousand; and the remnant were affrighted, and gave glory to the God of heaven.
Revelation 11:19 - “And the temple of God was opened in heaven, and there was seen in his temple the ark of his testament: and there were lightnings, and voices, and thunderings, and an earthquake, and great hail.”
When the sixth seal judgment passes over the United States, Satan will have sealed his people with the Mark of the Beast and God will have sent his ‘Ascending Angel’ to seal His people, the the ‘Great Earthquake’ will hit this earth and the tectonic plates will begin to shake and to crack. All the mountains of the earth and the islands of this earth will be shaken. The beginning of massive tectonic changes will begin.
Contrary to what most end time catastrophic futurists think, the great continental plates will not be just jamming harder against each other, but at this time will begin to separate. Within as little as eighteen months later, during the seventh trumpet and vial plague of the seventh seal, the great continents will begin to separate from each other, the tectonic uplifts will collapse and the great mountain chains on the continents will come crashing back down to this earth and the islands as oceanic mountains will collapse and settle to the bottoms of the oceans.. T
When God gets through with His judgments, the US weapons industry will be deactivated and buried deep into the earth. Chances are that this same judgment will be true to every nuclear, chemical and biological weapons facility in the world.
Part One - Planetary Changes at the Time of the End
Part Two – Isaiah the Catastrophic Prophet
Part Three - Major Earthquakes and Catastrophes in the Old Testament - Part One
Part Four - Major Earthquakes and Catastrophes in the Old Testament - Part Two
Part Five – Major Earthquakes and Catastrophes in the New Testament
Part Seven – Evidence of Catastrophes in the Natural World – Part Two
Part Eight – The Catastrophic Destruction and Restoration of Pangea
Part Nine - Eden as Pangea and the Flood as a Mass Extinction
Message from BibleSearchers
BibleSearchers scans the world for information that has relevance on the time of the end. It is our prayer that this will allow the believers in the Almighty One of Israel to “watch and be ready”. Our readiness has nothing to do trying to halt the progression of evil on our planet earth. In our readiness, we seek to be prepared for the coming of the Messiah of Israel so that goodness and evil will be manifested in its fullest. Our preparation is a pathway of spiritual readiness for a world of peace. Our defender is the Lord of hosts. The time of the end suggests that the Eternal One of Israel’s intent is to close out this chapter of earth’s history so that the perpetrators of evil, those that seek power, greed and control, will be eliminated from this planet earth. The wars of the heavens are being played out on this planet earth and humans will live through it to testify of the might, power, justice and the love of the God of Israel. In a world of corruption and disinformation, we cannot always know what the historical truth is and who is promoting evil or mis-information. We cannot guarantee our sources but we will always seek to portray trends that can be validated in the Torah and the testimony of the prophets of the Old and the New Testament.
FAIR USE NOTICE
This site contains copyrighted material the use of which has not always been
specifically authorized by the copyright owner. We are making such material
available in our efforts to advance understanding of environmental, political,
human rights, economic, democracy, scientific, and social justice issues, etc.
We believe this constitutes a 'fair use' of any such copyrighted material as
provided for in section 107 of the US Copyright Law. In accordance with Title
17 U.S.C. Section 107, the material on this site is distributed without profit
to those who have expressed a prior interest in receiving the included
information for research and educational purposes. For more information go to: http://www.law.cornell.edu/uscode/17/107.shtml
Links
Earthquake Links
Earthquake by USGS ( authors Kaye M. Shedlock and Louis C. Pakiser)
Introduction to Earthquakes by USGS
Earthquakes in History by USGS
Where Earthquakes Occur by USGS
How Earthquakes Happen by USGS
Measuring Earthquakes by USGS
Volcanos and Earthquakes by USGS
Predicting Earthquakes by USGS
USGS Earthquake Hazards Program
United States:
· Largest Earthquakes in the U.S.
· Other Large US Earthquakes, Magnitude 7 or greater.
· U.S. Largest Earthquakes, by State
· U.S. Earthquake History, by State
· Deaths from Earthquakes in the U.S.
· National Seismic Hazard Mapping Project
World:
· Largest Earthquakes in the World Since 1900
·
Significant
Earthquakes in the World, by Year Since 1980
(M6.5 or greater or caused fatalities, injuries or substantial damage)
· Most Destructive Earthquakes in the World
· Earthquakes in the World with 1,000 or More Deaths
· Earthquakes in the World this Year, Magnitude 7 and Greater
· Number of Earthquakes in the World per Year, Magnitude 7 and Greater
· Global Seismic Hazard Assessment Program
· Earthquake Statistics & Facts (World & U.S.)
More Links
Volcano Links
Volcano World by the University of North Dakota
Largest Volcanic Eruptions since 1400 CE by Volcano World
Ice Cores and Volcanos by the University of Buffalo
Mount Etna Volcano in Italy by Volcano World
Mount Vesuvius near Naples, Italy by Wheeling Jesuit University
Mount Vesuvius by Volcano World
Massive Magma Layer feed Vesuvius by BBC
Solar Flares
The Resurgent Sun by Science at NASA